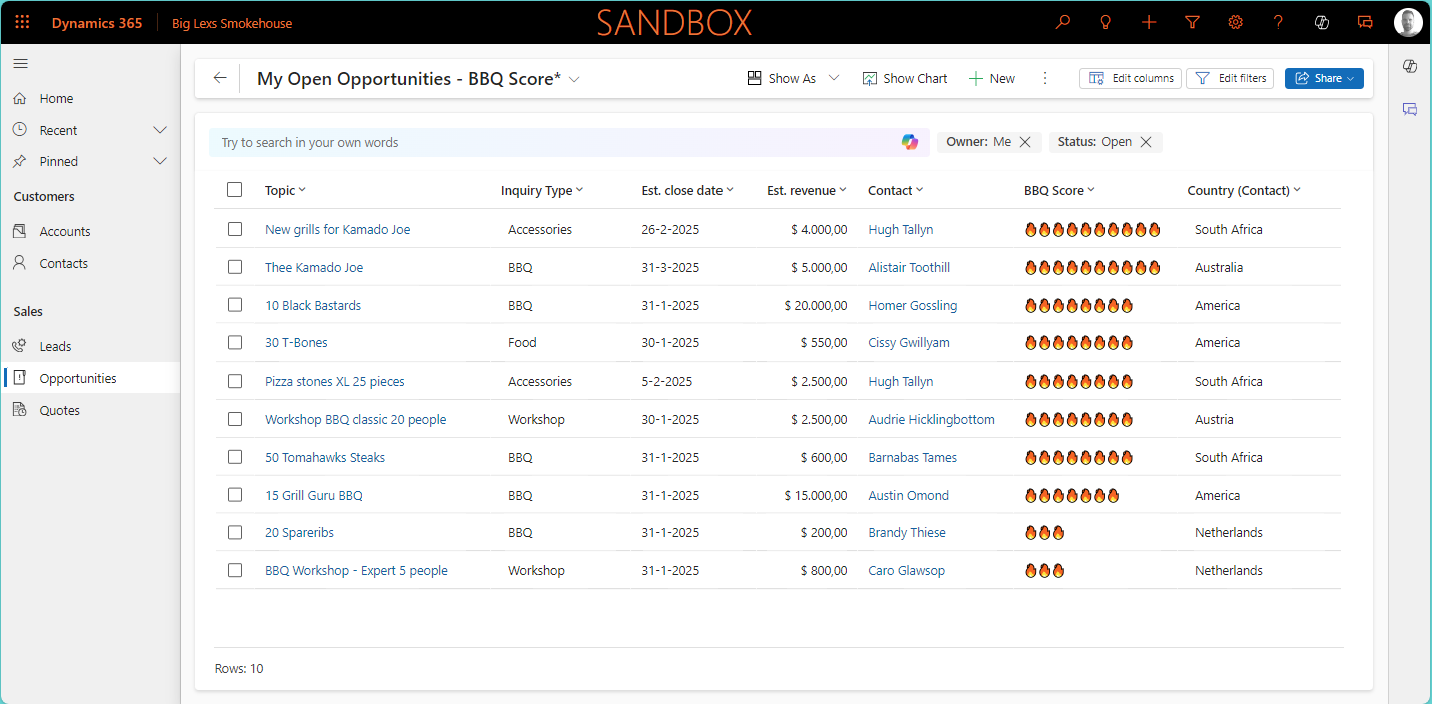
Another promising preview feature that has been released recently, now you can use Copilot to visualize data in views 😍. Based on the data and columns in your views, Copilot can now generate charts for you. These charts are, same as in the traditional charts, interactive which therefore allows you to drill into the data further and analyze it. In this post I will explain how to set this up, but also some of the important differences between the classic charts and Copilot charts.

Below you will see the traditional version of almost the same chart as above that most of you are familiar with.

How to configure Copilot to visualize data in views
In order to enable the feature Copilot to visualize data in views you need to follow the next steps:
- Open the Power Platform Admin Center
- Navigate to Environments
- Select the environment where you want to enable this for
- Select Settings
- Navigate to Features in the Products section
- Find the Natural Language Grid and View Search section
- Switch the setting: Allow AI to generate charts to visualize the data in a view (Production Ready Preview) to On.
- Press Save

How to use Copilot to visualize data in views?
Once the setting is enabled, which is a global setting and that is important to remember, you will get the Visualize button in the views available. At this stage, when the setting is enabled, you can’t use the classic charts anymore, unless of course, you turn the setting off again. To me this is a big disadvantage even though I do understand why this.

Once you select Visualize Copilot will analyze the columns and filters in the view selected to generate the chart. It does work in the same fashion that you can drill down and analyze data using the chart and the related/filtered data on the right side will be updated accordingly.
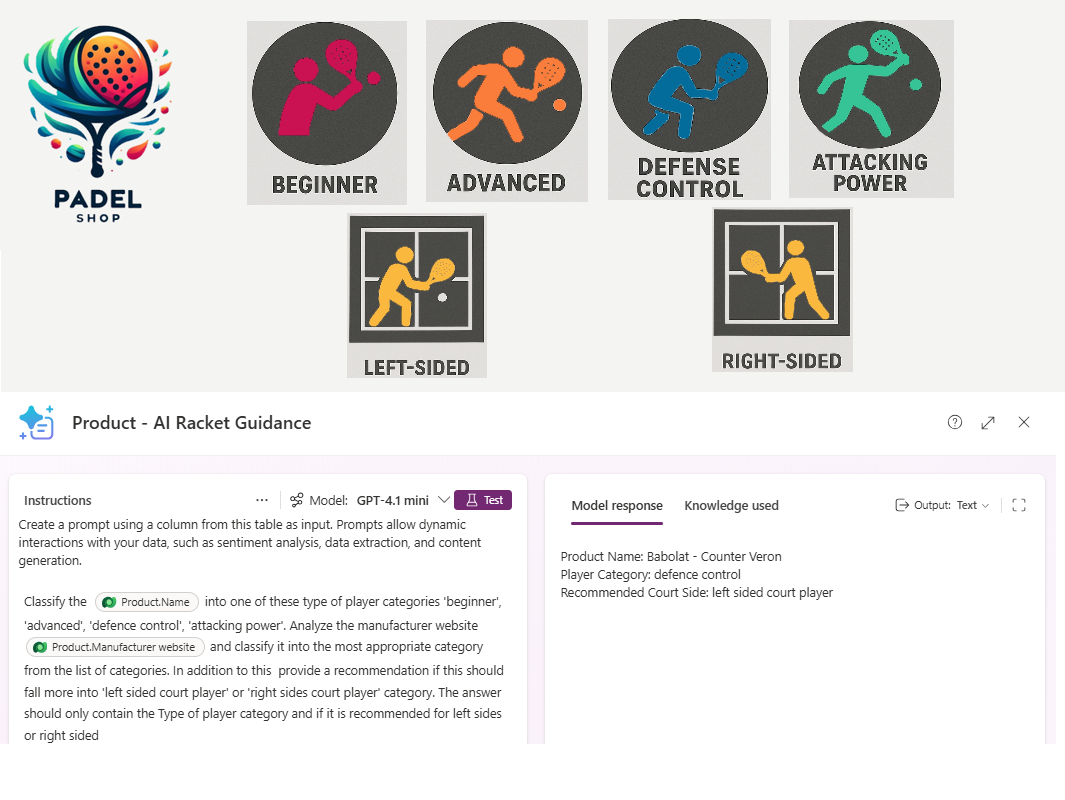
Copilot allows you to use the Explain function to generate a short description of the chart that is created.

Once the visualisation is generated you can use the Chart Selector in order to change the type of chart. When you compare this to the number of types available in the classic then there are fewer available.

The Copy function does work quite smoothly since this copies a .PNG file from the chart to the clipboard. This allows you to paste this straight into Word or PowerPoint for example.

Using the Arrows at the upper right corner you can make the chart full-screen which can help in analyzing big data sets. This feature is the same as it is in the classic charts.

Overview of Classic vs Copilot
So if you ask me if you should use Copilot to visualize data in views then the answer is probably “not yet” or “in some cases”. You have seen some of the highlights now of this new preview feature which is promising but when you look at the pros for each option below you will probably also conclude that there is a bit of work to do, especially around collaboration and dashboarding.
Classic
- Able to Save Charts
- Able to Share and use in Dashboards
- More different types of charts are available
- More control over the generated output
Copilot
- Improved user interface
- Able to generate charts when there are no charts available for the specific table
- Able to copy the chart as .PNG to the clipboard
- Generate AI description via the Explain function