
Before Johan can predict anything, he needs a brain. In the intro post (link here) I shared already to show exactly how I built it, combining three Kaggle datasets, joining them with FIFA historical rankings, and calculating rolling form statistics without duplicating a single row 🤖
I must honestly say, this is the least glamorous part of this fun project. There are no Copilot Studio screenshots here, no slick agent interfaces, and no predictions yet. Just data. But AI Agent Johan’s brain is only as good as what goes into it and getting that right is what separates this from the 2024 model.
What was actually wrong with the 2024 model
Before I explain what I build this time, I need to be honest about what was broken or not great in 2024. This was driving me to get much better data in the new data layer.
The 2024 model was trained exclusively on historical Netherlands 🐯 matches. You want to predict Netherlands games, so you train on Netherlands data, right? The problem is that this gives you an extremely thin dataset. The Netherlands does not play that many matches per year, and once you filter down to an opponent the number of games gets even smaller. Below a screenshot of how the dataset was back in 2024.
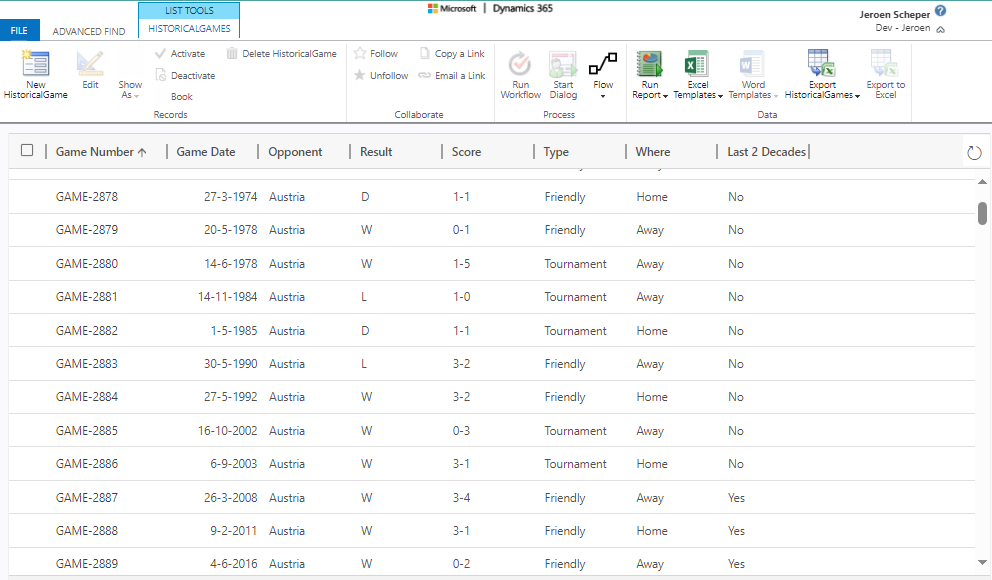
AI Builder has a requirement that says you need a minimum of 50 training rows with at least 10 examples per outcome class (Win, Draw, Loss). With Netherlands-only data you barely clear that bar, and my solution at the time was to copy all historical rows four times to hit the threshold. It worked. The model trained. But it was a workaround, not a solution. Duplicating rows does not add information, it just makes the model more confident in the same limited patterns.
On top of the thin data, the three columns I used, later in the tournament four, gave the model almost no context to work with:
- Opponent
- Home / Away
- Friendly / Tournament
- Last 2 decades Yes / No
That is it. The model had no idea whether the Netherlands had scored twelve goals in their last five games or zero. It had no idea whether the opponent was ranked 3rd or 53rd in the world. It was essentially pattern-matching on historical head-to-head results with a couple of contextual flags on top.
The decision to go broader
The fix required a different way of thinking about the problem.
Instead of asking “how has the Netherlands performed historically?”, the better question is “what does winning international football look like, across all nations and all major tournaments?”
A Netherlands win in a group stage game against a lower-ranked team looks similar to a Brazil win in the same situation, or a Spain win, or a Japan win. Those patterns repeat across nations. If you train only on Netherlands data you will never see enough examples of them to learn reliably. If you train on all major international football, those patterns become very clear.
So that is what I did. Johan is trained on all major international tournaments from 1990 onwards:
- World Cup
- UEFA Euro
- UEFA Nations League
- Copa América
- AFCON
- AFC Asian Cup.
The official introduction of the FIFA Ranking was in the year 1992, since that would be one of the variables I have used for my new model the year was chosen on purpose. The result is 7,666 training rows covering 182 nations. No duplication. Real variety. A dataset that has genuinely seen what international football looks like from almost every angle.
Getting the data: Kaggle
The data came from Kaggle, which if you have not used it is a platform that hosts public datasets contributed by the data community. Credits to them🙌 For international football there are several well-maintained datasets available that cover historical match results, team metadata, and FIFA rankings going back decades (link to Kaggle datasets: here)
I used three datasets in total to get full coverage. Each one covered different tournaments or time ranges, and combining them was necessary to avoid gaps and particularly for tournaments like the Nations League which is relatively recent, and regional competitions like AFCON and the AFC Asian Cup which are not always included in the more popular generic football datasets.
The raw state of the combined data before any cleaning was, to put it diplomatically, not great. Country names were inconsistent across sources (sometimes “Netherlands”, sometimes “Holland”, sometimes “The Netherlands”). Tournament names had different formatting conventions. Some matches had stage information, others did not. A fair amount of manual mapping and cleaning work was needed to get everything into a consistent shape before any joins could happen.

Why every match is registered twice
This is probably the most counterintuitive thing about the data model, so I thought it made sense to explain. Every match in the training set is registered as two rows: one from Team A’s perspective and one from Team B’s perspective. The reason for this comes down to how the model is used. When you ask Johan to predict a Netherlands match, the prediction is made from the Netherlands perspective — will this team win, draw, or lose? For the model to learn that pattern, it needs to have seen thousands of examples of what winning and losing look like from a single team’s point of view. If you only store one row per match, the model sees the result as a neutral event. That is not how football works, and it is not how predictions work either.
A concrete example: Netherlands 2–1 Argentina becomes:
| Team | Opponent | Result |
|---|---|---|
| Netherlands | Argentina | Win |
| Argentina | Netherlands | Loss |
Same match. Same facts. Two valid training records, each telling the story from a different team’s vantage point. The useful side effect of this is that it legitimately doubles the training data without fabricating anything. 7,666 rows represents 3,833 actual matches, each registered twice. No duplication, just perspective.
This also explains why all the rolling form statistics are calculated per team per row, not per match. Each row represents one team’s journey into that game — their form, their momentum, their context. Those stats need to reflect that specific team’s situation going into the match, not some neutral summary of the fixture.
The Teams table: the missing piece
Here is something the 2024 model did not have at all, and that turned out to be more important than I expected: a dedicated Teams table.
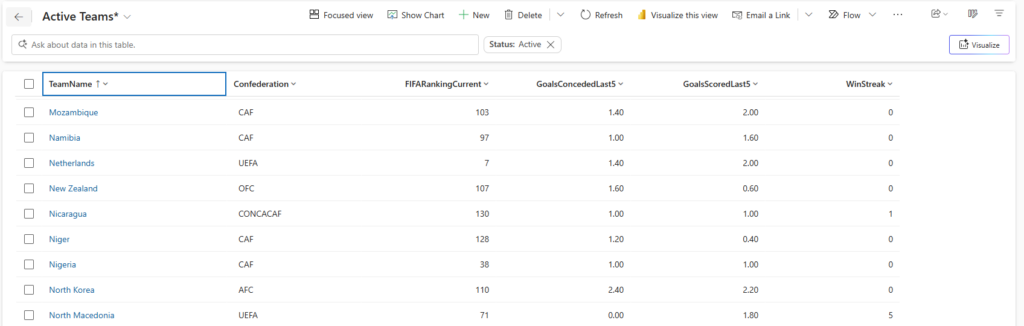
At first glance this might seem unnecessary. The match data already contains team names as text values in each row — why do you need a separate table for teams? The answer is that a name is not enough. To calculate rolling form statistics and join FIFA rankings reliably, you need a stable, consistent reference for every team that appears in your dataset. This will also help later in the process to get latest ‘facts’ in order to predict the next match of the Netherlands.
The Teams table has a simple but essential structure:
| Column | Description |
|---|---|
| Team ID | A unique identifier for the team, used to join across all other tables |
| Team name | The canonical name used consistently throughout the dataset |
| Confederation | UEFA / CONMEBOL / CAF / AFC / CONCACAF / OFC — which footballing confederation this team belongs to |
| Current FIFA Ranking | Current ranking at time of tournament |
| GoalsScoredLast5 | latest 5-game average of goals scored |
| GoalsConcededLast5 | latest 5-game average of goals conceded |
| WinStreak | Current win streak entering the tournament / next match |
Giving Johan real context: the enrichment columns
With a solid base dataset and a clean Teams table in place, the next step was adding the columns that actually give Johan something meaningful to reason with. This is where the 2024 model was most obviously limited, and where the biggest improvements came from.
FIFA ranking difference Not the absolute ranking, but the gap between the two teams. A fixture between the #7 and #45 ranked sides is a very different prediction problem than #7 vs #8, even if the absolute numbers look similar. The ranking difference captures that competitive imbalance directly.
The technical challenge here is that FIFA rankings change after every matchweek, so you cannot just use today’s ranking and join it to historical matches. You need the ranking at the time of the match. This does rely on a proper data source, from in my case Kaggle. Getting this right matters — using the wrong ranking data would introduce information that did not exist at the time, which would make the training data unrealistic.
Goals scored last 5 games How many goals did this team score across their last five matches going into this game? A team averaging three goals per game in their recent run is in a very different attacking position than one that has scored twice in five games.
Goals conceded last 5 games The defensive equivalent. Independently useful, a team can be scoring freely but leaking goals at the back, which changes the prediction profile significantly.
Win streak A simple count of consecutive wins going into the match. Momentum is real in tournament football. A team on five straight wins carries a different kind of confidence and pressure than one that has just come through a difficult run of draws.
Tournament stage Group / R32 / R16 / QF / SF / Final. This one is important because the stakes of a match change the dynamic completely. Teams approach group stage games differently than knockout rounds. Upsets are more common in certain stages than others. The model needs to know where in the tournament a match sits.
The final data model
Putting it all together, the data layer for AI Agent Johan’s brain consists of two tables..
The Teams table is the reference layer — 182 rows, one per nation, providing clean and consistent team identities across the entire dataset.
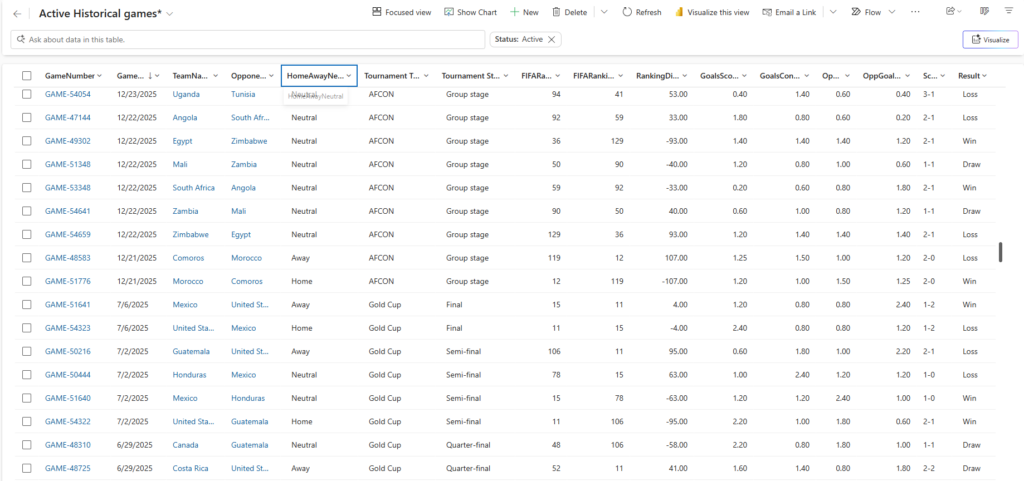
The Historical Matches table is the training layer — 7,666 rows, one per team per match, containing everything the AI Builder model will learn from. Its full structure looks like this:
| Column | Description |
|---|---|
| Team ID | Reference to the Teams table |
| Opponent ID | Reference to the Teams table for the opposing side |
| Home / Away / Neutral | Match location from this team’s perspective |
| Tournament type | World Cup / Euro / Nations League / Copa América / AFCON / AFC Asian Cup |
| Tournament stage | Group / R32 / R16 / QF / SF / Final |
| FIFA ranking difference | This team’s FIFA rank minus opponent’s rank at match date |
| Goals scored last 5 | Goals scored by this team in their last 5 matches |
| Goals conceded last 5 | Goals conceded by this team in their last 5 matches |
| Win streak | Consecutive wins going into this match |
| Opponent Goals scored last 5 | Goals scored by Opponent in their last 5 matches |
| Opponent Goals conceded last 5 | Goals conceded by Opponent in their last 5 matches |
| Opponent Win streak | Consecutive wins by Opponent going into this match |
| Result | Win / Draw / Loss — this is what the model predicts |
That last column is the target. Everything else is input. Johan takes those inputs for an upcoming match and returns a predicted Result with a confidence score.
What’s next
The data layer is done. Two tables. 182 nations. 7,666 training rows. Zero duplication.
In the next post I use AI Builder to train AI Agent Johan 🤖


Comment