When it comes to the adoption of different business applications, one of the things that you would like to get insights in is how well the application is being used. There are multiple ways how to get insights into this, for example:
- creating a custom dashboard with KPIs based on views and charts to your needs
- creating a custom PowerBI dashboard or report with the KPIs you want
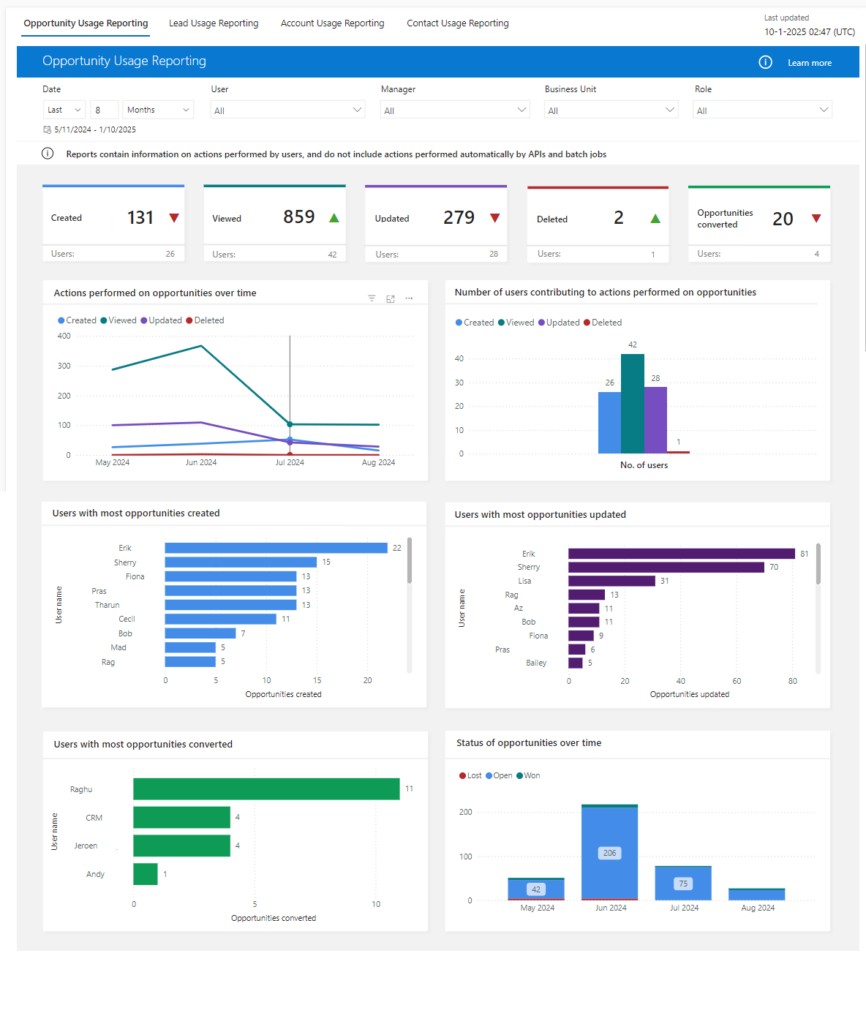
Now the good news is, that when it comes to sales, Microsoft does have the option to enable Sales usage reports, which consist of 4 reports with their metrics / KPIs:
- Opportunity usage report
- Lead usage report
- Account usage report
- Contact usage report
Before I go into the details of the usage reports, a couple of things that are good to know beforehand:
- Once enabled, it can take up to 24 hours for the usage reports to appear.
- The data in the usage reports are refreshed every 24 hours, I did not come across a way to change the frequency of this. If you do, then please let me know via the comments.
- Only actions that are performed in the application are included in the metrics, so records that are either bulk updated, bulk created or created via an API are not included.
- The Sales Usage Reports option will standard only appear in the Sales Hub app
Filters on the usage reports
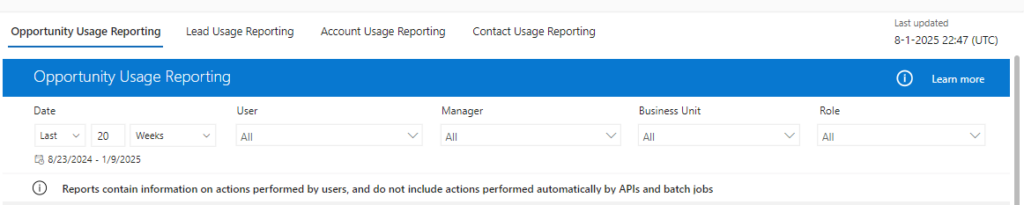
In the top bar you do have the option to filter your report on the following values:
- Date; select a number and the time unit like days, weeks, months, or years
- User; select one or multiple enabled users
- Manager; select a specific manager, this list is based on users where the Manager field is set
- Business Unit; select one or multiple business units
- Role; this is a bit of a funny one, where I initially thought, or perhaps hoped, it would be the positions that you can setup that are being used in the position hierarchy, but instead you do have the option to select one or multiple Security Roles which I personally think is a bit weird.
Opportunity usage report
The perhaps most interesting usage report is probably the opportunity usage report, therefore I will discuss that one in more detail. Full documentation on Microsoft Learn about the different usage reports can be found here: View operational metrics and KPIs in Sales usage reports | Microsoft Learn
Below is a snapshot of the official documentation for the different KPIs and the chart names that you can find in this usage report for opportunities. Within the tiles the green (up) and red (down) arrows are indicating what the trend is in comparison to the previous period.

| KPI | Description |
|---|---|
| Created | The number of opportunities sellers created, and the number of sellers who created opportunities, during the specified time period |
| Viewed | The number of opportunities sellers viewed, and the number of sellers who viewed opportunities, during the specified time period |
| Updated | The number of opportunities sellers updated, and the number of sellers who updated opportunities, during the specified time period |
| Deleted | The number of opportunities sellers deleted, and the number of sellers who deleted opportunities, during the specified time period |
| Opportunities converted | The number of opportunities sellers converted into won deals, and the number of sellers who converted opportunities, during the specified time period |
| Chart name | Description |
|---|---|
| Actions performed on opportunities over time | The trend of actions taken on opportunities in the specified time period: created, viewed, updated, and deleted |
| Number of users contributing to actions performed on opportunities | The number of users who performed various actions on opportunities during the specified time period |
| Users with most opportunities created | The top four contributors who created opportunities during the specified time period |
| Users with most opportunities updated | The top four contributors who updated opportunities during the specified time period |
| Users with most opportunities converted | The top four contributors who converted opportunities into won deals during the specified time period |
| Status of opportunities over time | A breakdown of opportunities by status during the specified time period |
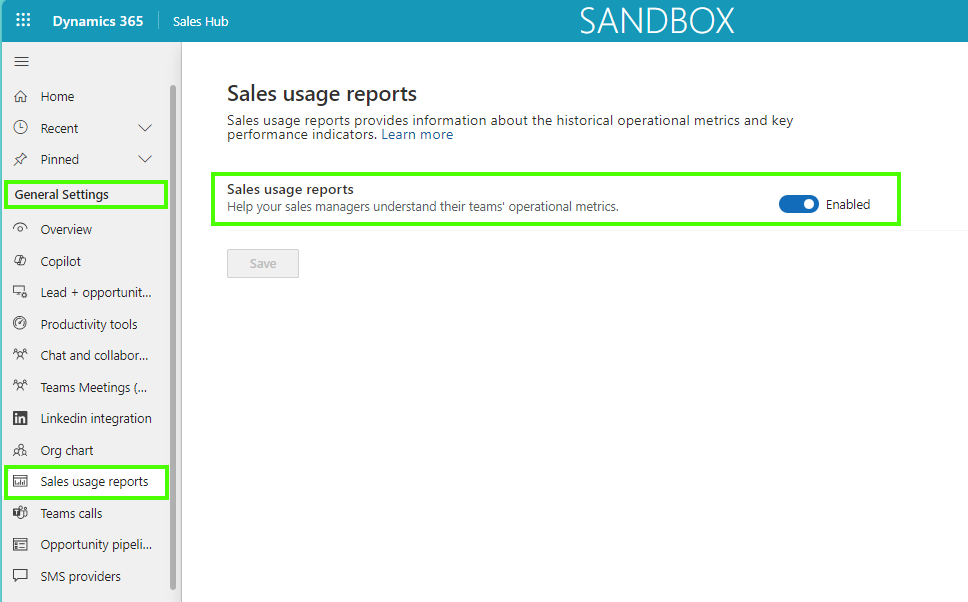
How do you enable sales usage reports in your environment?
In order to enable Sales usage reports to gain insights into sales activities you need to follow the next steps:
- Open the Sales Hub App
- Navigate to the App Settings area
- In the General Settings section find the Sales usage reports option
- Enable the Sales usage reports setting
- Select Save