Skip to content
JScheper.com
JScheper.com

BizApps, Powerplatform and AI

  • Home
  • Blog
  • Contact
JScheper.com

BizApps, Powerplatform and AI

AI Insight Cards for tables

Using AI record summary for tables

Posted on January 28, 2025January 27, 2025 By Jeroen Scheper

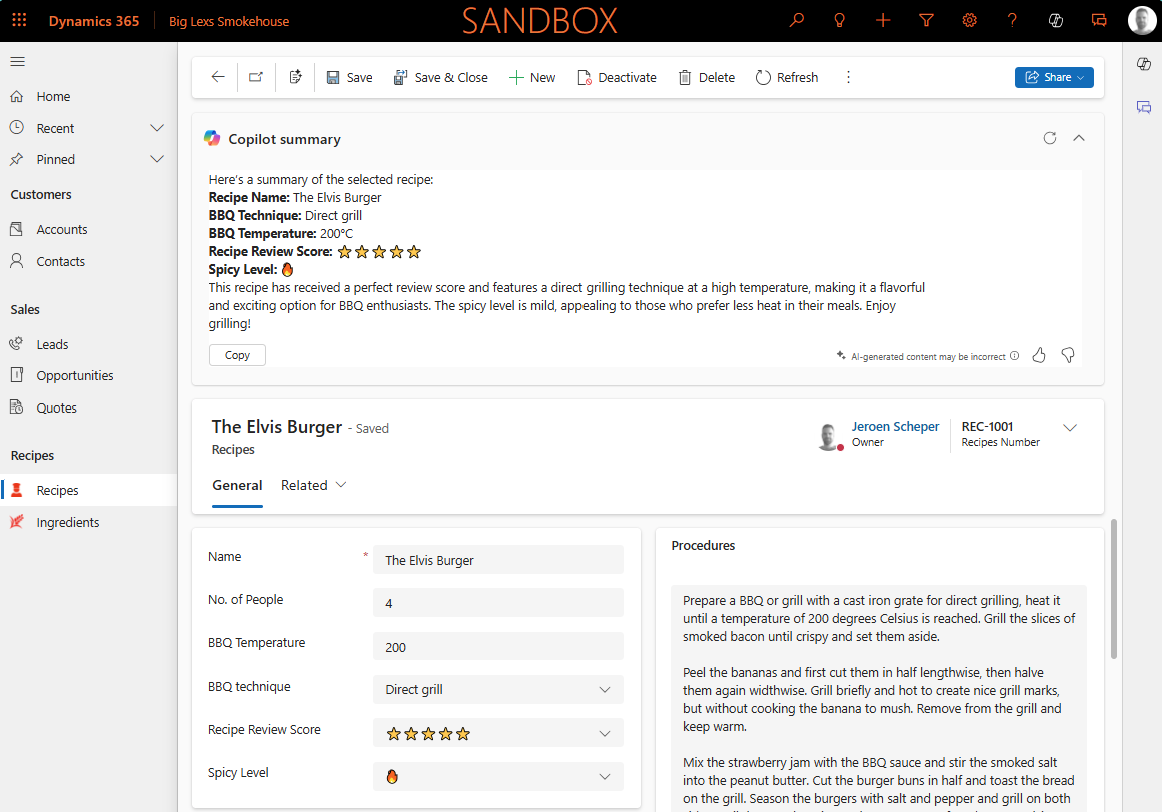
One of the things that was just released in Public Preview is the AI record summary for tables (link to release plan). The cool thing about this feature is that it allows you to create your own custom AI Prompt, which will then be used to display the Copilot summary of your record on the main form.

AI insight cards for tables

How do you enable AI record summary for tables?

In order to enable the AI record summary for tables we need to find the AI insight cards setting and switch this on. You can find this setting by following the next steps:

  • Open the Power Platform Admin Center
  • Navigate to Environments
  • Select the environment where you want to enable this for
  • Select Settings
  • Navigate to Features in the Products section
  • Find the AI insight cards (preview) feature
  • Enable the setting
  • Press Save

How do you configure the AI record summary for tables?

When the AI insight card setting is enabled, this will then enable the Row summary option that is being displayed in the Customizations section of the table.

When clicking on this, it will bring up the AI Prompt screen where you can create your prompt and test it straight away. Via the + Add data button on the right side you can add information from the table that needs to be used in your summary, in my scenario Recipes. I came up with the following AI Prompt:

Create a Recipe summary for selected record based on: Recipe Name, BBQ Technique, BBQ Temperature, Review Score and the Spicy level.

When you are working on your AI Prompt it is good to test this occasionally during this creation process. If you select Test prompt you will see in the bottom section the created summary of the record using AI technology. Once you you are happy with the outcome, you select Apply to main forms and it will be applied to only the main forms of your table. Microsoft has great materials on the Microsoft Learn page about AI Prompting and how to get better at it.

If you open your table and check the Customization section again, you will see that the Row summary does now say (applied).

Since I am working on a solution, the AI Prompt being used for the Row summary can be found in the AI Skill Config section of your solution

So to conclude, I think the AI record summary for tables is a very promising feature but I do find the setting that enables all of this a bit confusing. Perhaps the setting will drive more functionalities or features in the future.


AI Prompting Artificial Intelligence Copilot Model-driven Apps 2025 release wave 1AI Insight CardsAI Record summaryBig Lex's Smokehouse

Post navigation

Previous post
Next post

Related Posts

AI Builder use AI Prediction model

Use the AI Builder Prediction model to predict how the Netherlands will perform at Euro 2024

Posted on June 13, 2024July 17, 2024

Some of you who know me, know that I am a big sports fan, especially soccer or football depending on who you speak to😁. Tomorrow the UEFA Euro soccer tournament in Germany starts. Since we, the Netherlands, almost never win a tournament I thought let’s use AI Builder prediction model…

Read More
Model-driven Apps

Use colors for choice columns in your views

Posted on December 11, 2024December 10, 2024

Last week I posted something about the Power App Grid Control that allows you to get the jump bar back in your views (read the full post here). One of the other cool settings on this control is it allows you to use colors for choice columns in your views,…

Read More
Copilot Copilot to visualize data in views

Using Copilot to visualize data in views

Posted on March 5, 2025February 25, 2025

Another promising preview feature that has been released recently, now you can use Copilot to visualize data in views 😍. Based on the data and columns in your views, Copilot can now generate charts for you. These charts are, same as in the traditional charts, interactive which therefore allows you…

Read More

Leave a Reply Cancel reply

Your email address will not be published. Required fields are marked *

ABOUT ME

  • LinkedIn
  • Mail
  • GitHub
  • YouTube
"BizApps and PowerPlatform dude with a passion for AI, sitting relaxt in his black shirt on a bounty white beach with palm trees, a azure blue ocean in the background and enjoying a good coffee "

~GenAI - DALL.E 3 and GPT 3.5

Subscribe

Please wait...

Thank you for subscribing!

Search

Categories

  • Agents
  • AI Builder
  • AI Prompting
  • Artificial Intelligence
  • Copilot
  • Copilot Studio
  • Customer Insights
  • Customer Service
  • Dataverse
  • Field Services
  • Generative AI
  • Model-driven Apps
  • Personal Development
  • Power Apps
  • Power Automate
  • Power BI
  • Power Platform
  • Reporting
  • Sales
  • SharePoint

Archive

  • September 2026
  • July 2026
  • June 2026
  • May 2026
  • March 2026
  • February 2026
  • January 2026
  • December 2025
  • November 2025
  • October 2025
  • August 2025
  • July 2025
  • June 2025
  • May 2025
  • April 2025
  • March 2025
  • February 2025
  • January 2025
  • December 2024
  • November 2024
  • October 2024
  • September 2024
  • August 2024
  • July 2024
  • June 2024
  • May 2024
Β© 2024 - All rights reserved | Jeroen Scheper | Privacy Policy